


BTC’s recent recovery may be hiding a dangerous signal. The Bitcoin price bounced nearly 9% between February 12 and February 15, giving the impression that the worst of the correction was over.
But the rebound is already weakening. Now, leverage data, momentum signals, and on-chain profit trends suggest the bounce may have increased crash risk instead of ending it.
Sponsored
Sponsored

Bitcoin’s 9% Bounce Drew Nearly $2 Billion in Long Bets
Between February 12 and February 15, Bitcoin climbed roughly 9%. At the same time, futures traders aggressively positioned for further upside. Total open interest, which tracks the total value of active futures contracts, rose from $19.59 billion to $21.47 billion. This was an increase of about $1.88 billion, or roughly 9.6%, between February 13 and February 15.
This increase did not happen in isolation. Funding rates also turned strongly positive, rising toward +0.34%. The funding rate is the fee paid between long and short traders. When it is positive, long traders pay short traders. This shows that most BTC traders were betting on prices rising.
Want more token insights like this? Sign up for Editor Harsh Notariya’s Daily Crypto Newsletter here.
Together, rising open interest and positive funding rates confirmed that the market was positioning for a larger recovery. But the larger chart structure reveals a critical problem.
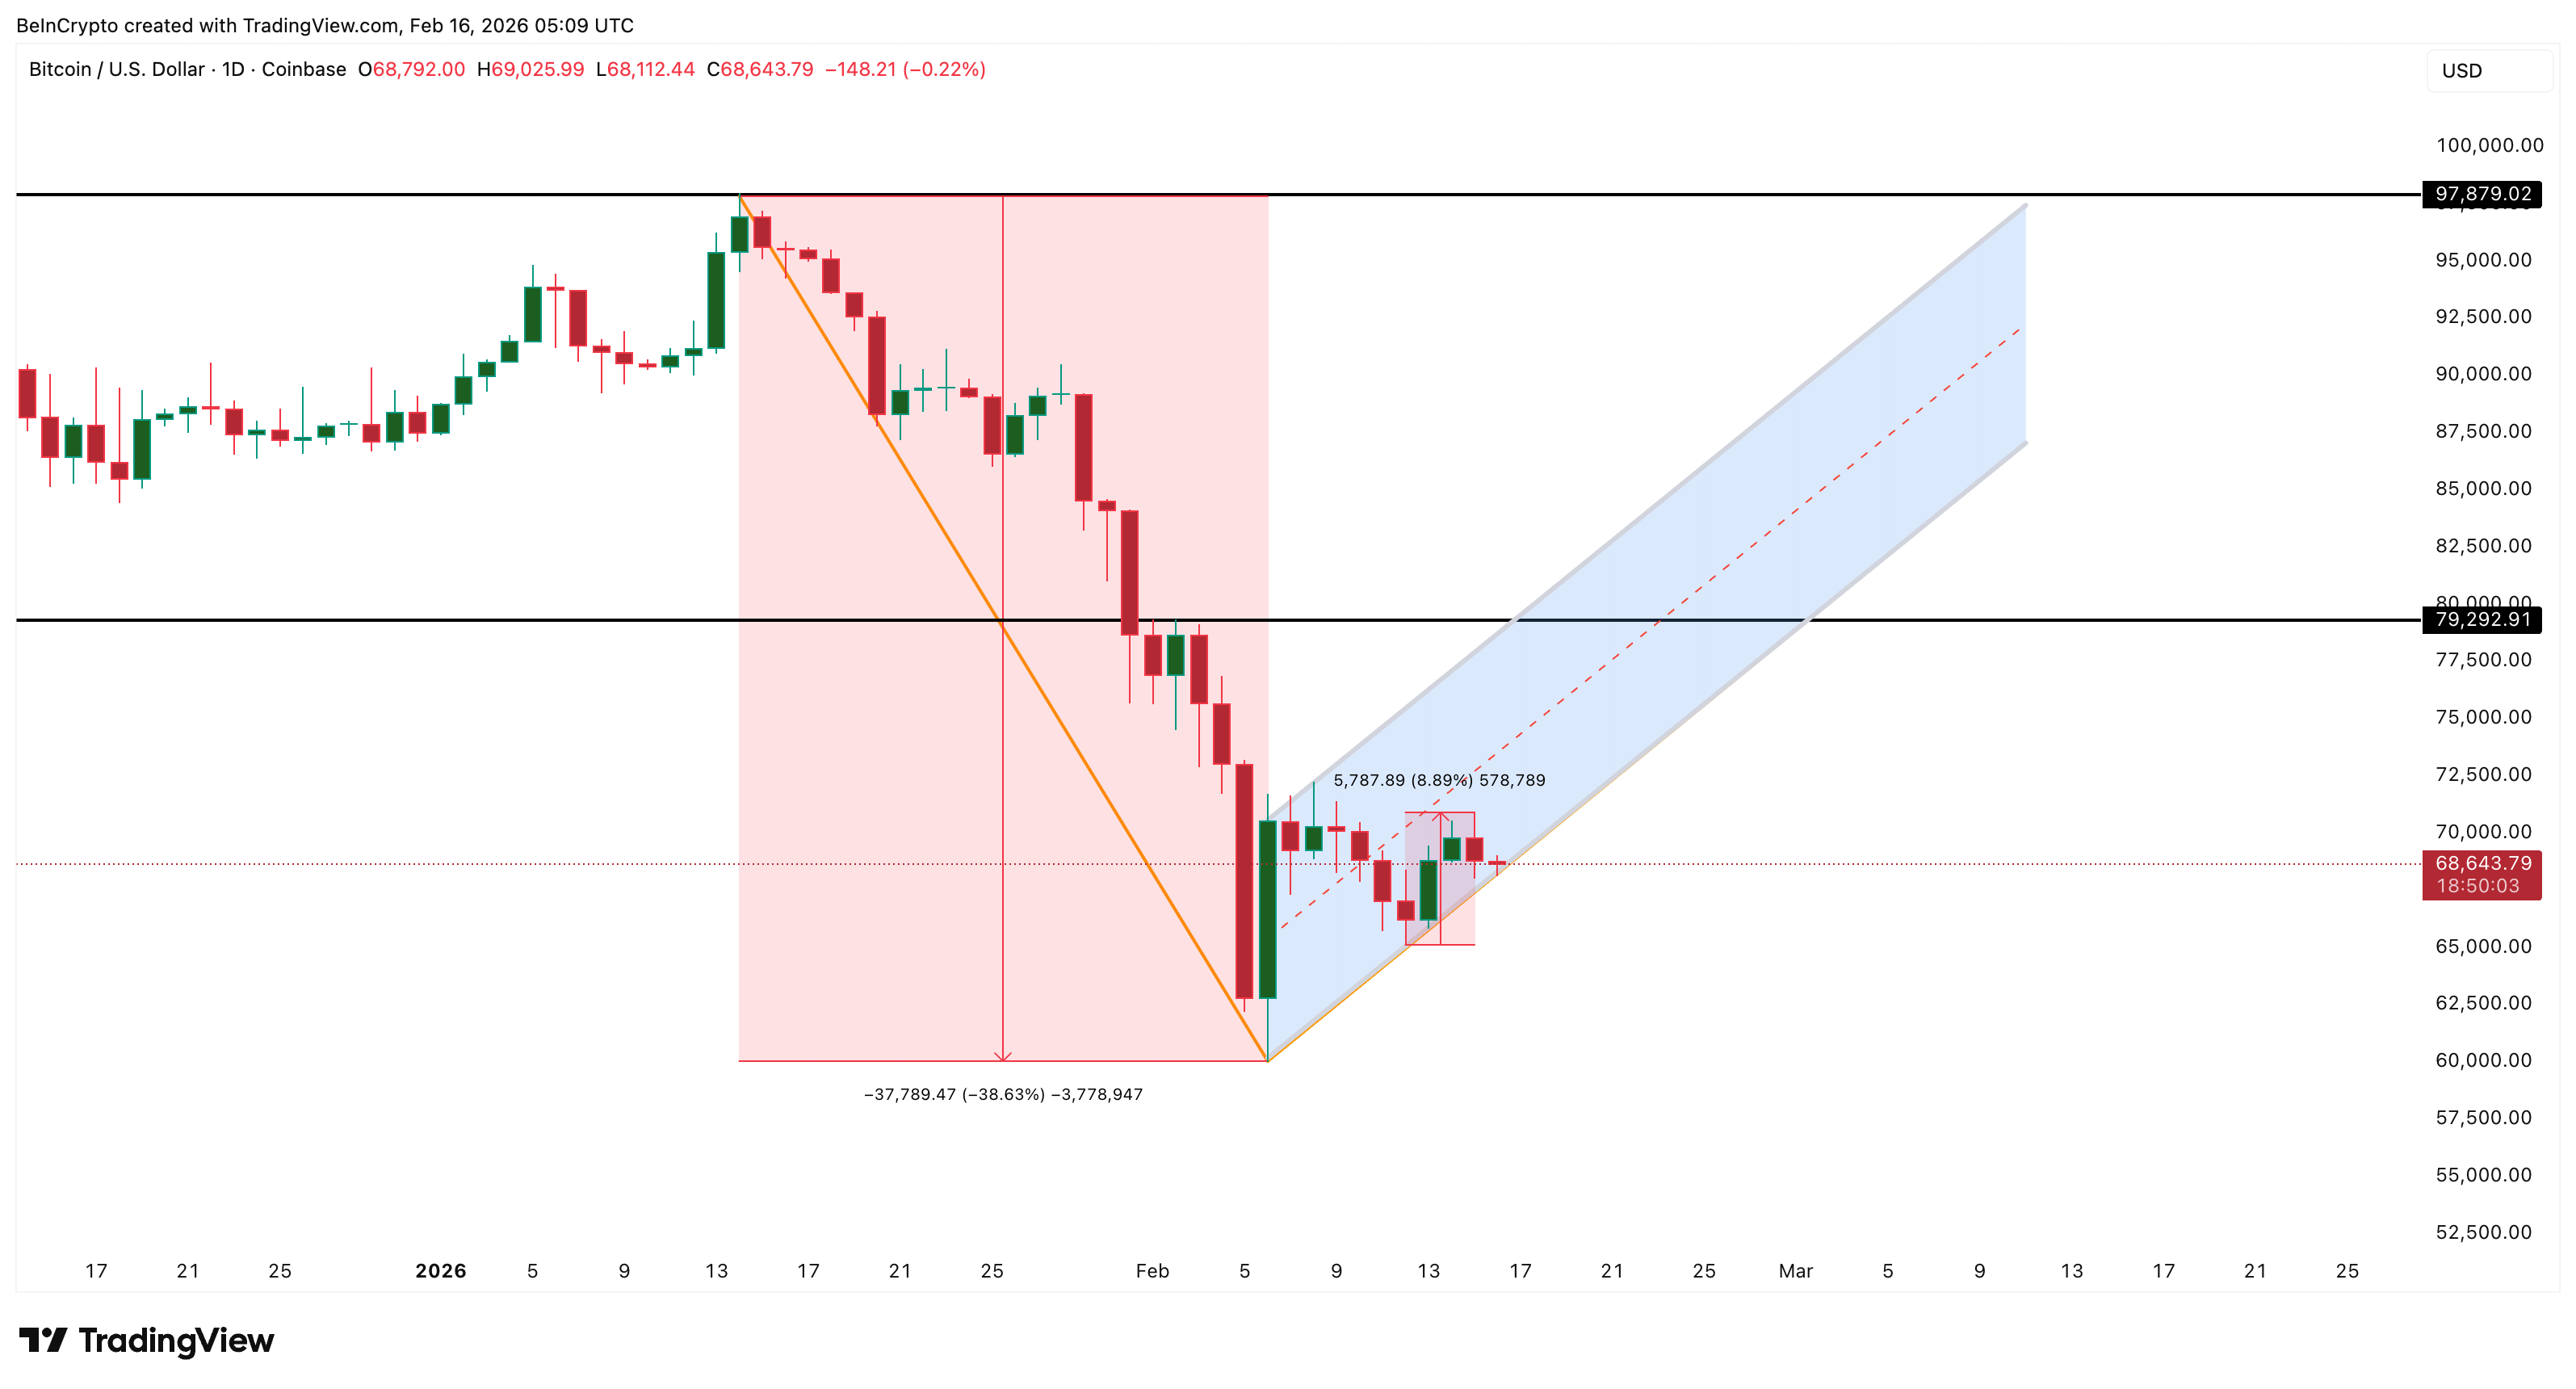
This entire rebound happened inside a bear flag pattern. A bear flag forms when the price rises slowly after a sharp drop but remains inside a downward continuation structure. It often acts as a pause before another decline.
Sponsored
Sponsored
The recent rejection near the local peak and the ongoing pullback now show that Bitcoin is still trading inside this bearish pattern. Price is already drifting toward the lower boundary of the flag. If this lower support breaks, the next leg of the weakening Bitcoin price prediction could begin.
Hidden Bearish Divergence and 90% Profit Surge Show Sellers Are Returning
Momentum indicators are now starting to confirm this growing weakness. On the 12-hour chart, Bitcoin formed a hidden bearish divergence between February 6 and February 15.
During this period, the price formed a lower high, meaning the recovery was weaker than the previous peak. But the Relative Strength Index, or RSI, formed a higher high. RSI measures the strength of buying and selling momentum.
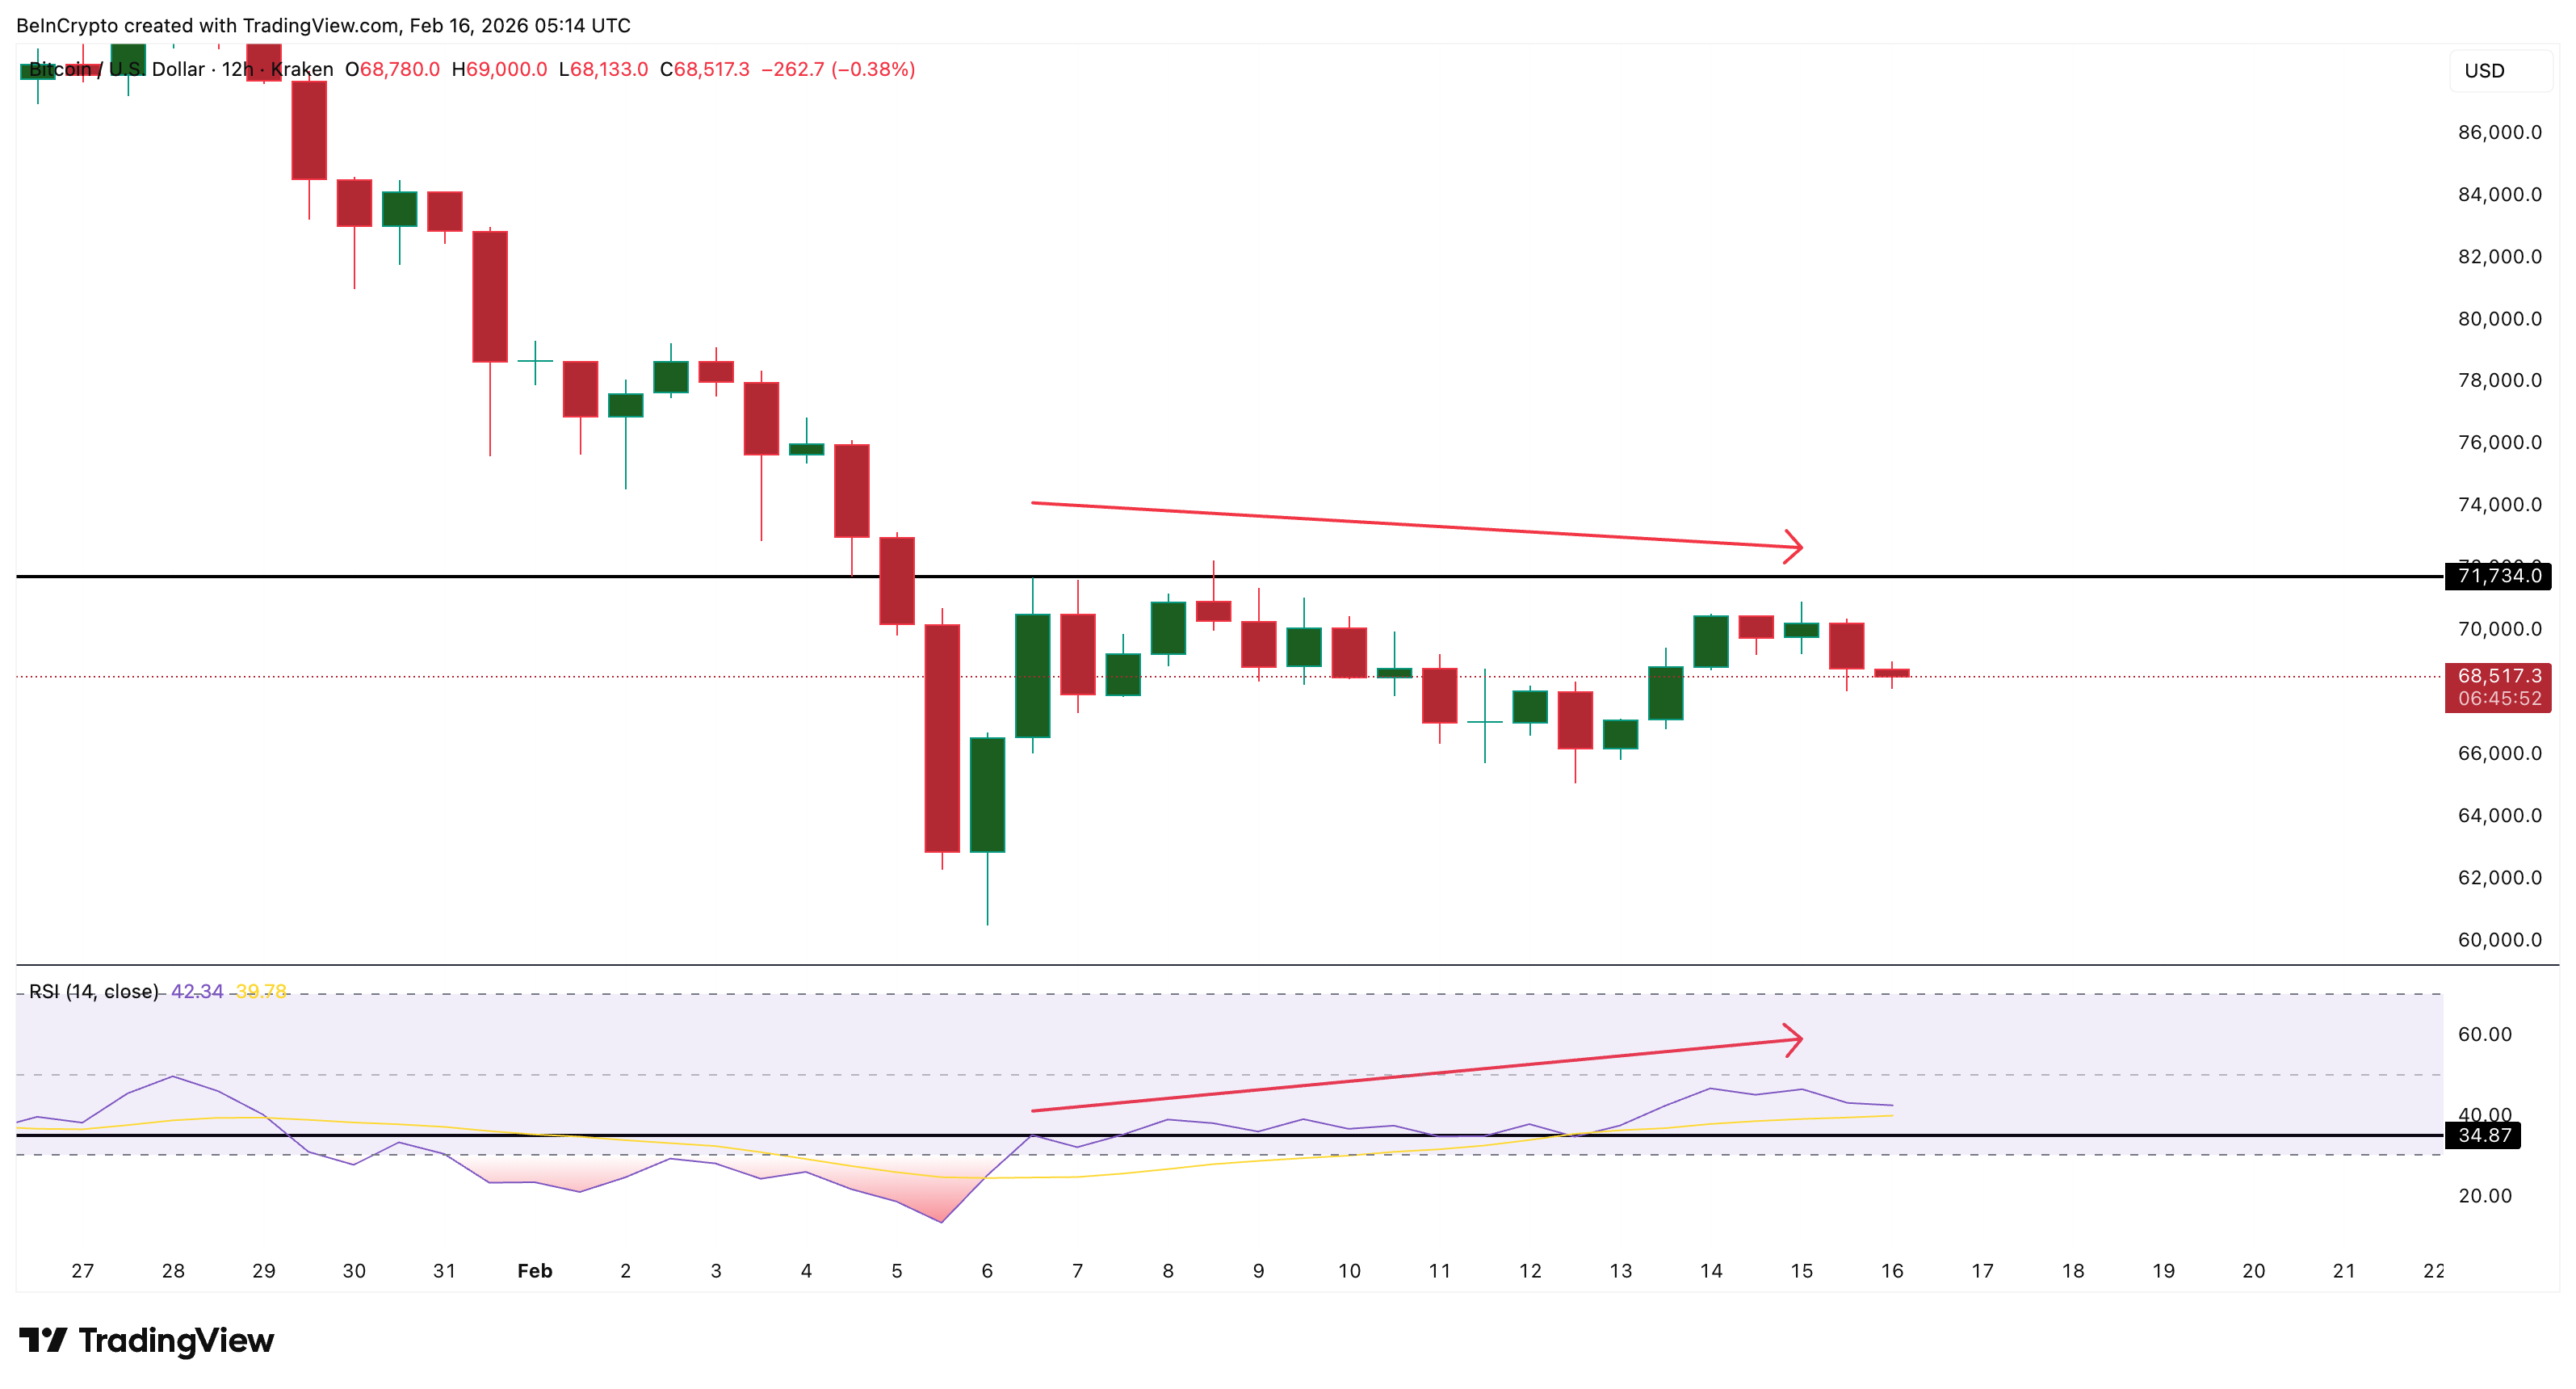
This combination is called hidden bearish divergence. It usually appears when buying momentum rises temporarily, but the overall trend remains weak. It signals that sellers are quietly regaining control. Shortly after this signal appeared, Bitcoin’s pullback began.
Sponsored
Sponsored
At the same time, on-chain profit data surged sharply, creating another warning sign. Bitcoin’s Net Unrealized Profit/Loss, or NUPL, rose from 0.11 on February 5 to 0.21 on February 14. This was an increase of about 90%. It is currently moving near the same zone, at press time.
NUPL measures the average unrealized profit across all Bitcoin holders. It shows how much profit investors are holding on paper. When NUPL rises sharply, it means many investors are suddenly back in profit, even if it is a small amount. This increases the risk of profit-taking.
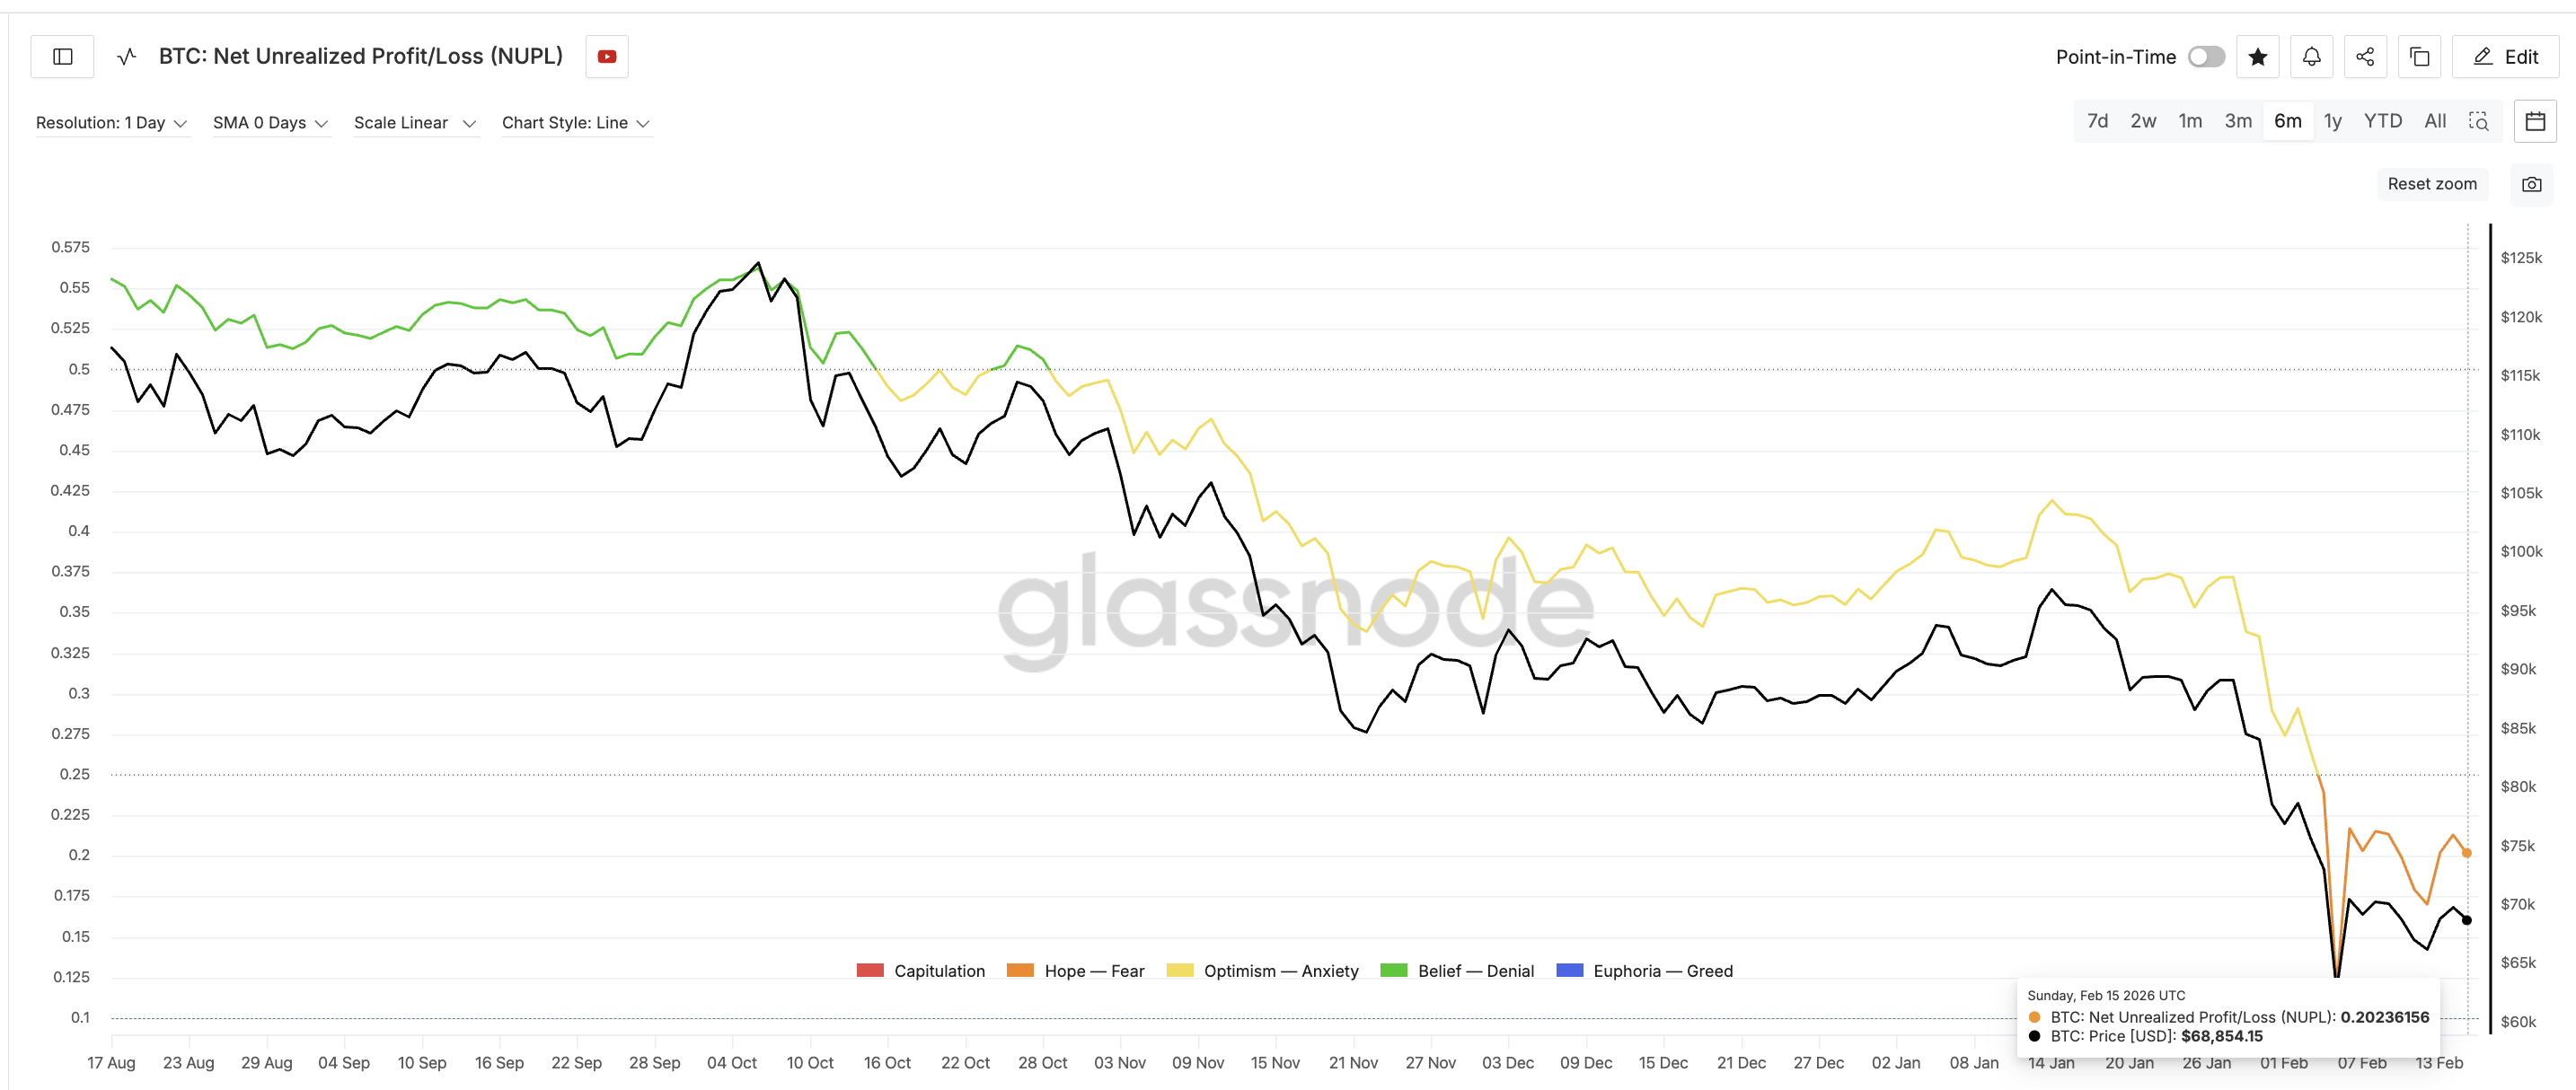
The last time NUPL reached similar levels was on February 4. At that time, Bitcoin was trading near $73,000. Within one day, the price collapsed to around $62,800. That was a drop of nearly 14%. Now, the same profit structure has appeared again.
This creates a scary situation. Investors holding fresh profits may sell quickly if prices start falling. That selling can accelerate the correction. This aligns with the hidden bearish divergence already visible on the chart.
Sponsored
Sponsored
Together, these signals show that the recent bounce may have strengthened sellers instead of removing them.
Key Bitcoin Price Levels Show Breakdown Risk Toward $58,800
Bitcoin is now approaching the most important support zone in its current structure. The first critical level is $66,270. This level forms near the lower boundary of the bear flag pattern breaks.
If Bitcoin breaks below this Fib level, the bearish continuation pattern would activate. The next major downside target sits at $58,880 (the $58,000 zone). This level aligns with the 0.618 Fibonacci retracement level ( a structurally strong zone) and represents roughly a 14% decline from current prices.
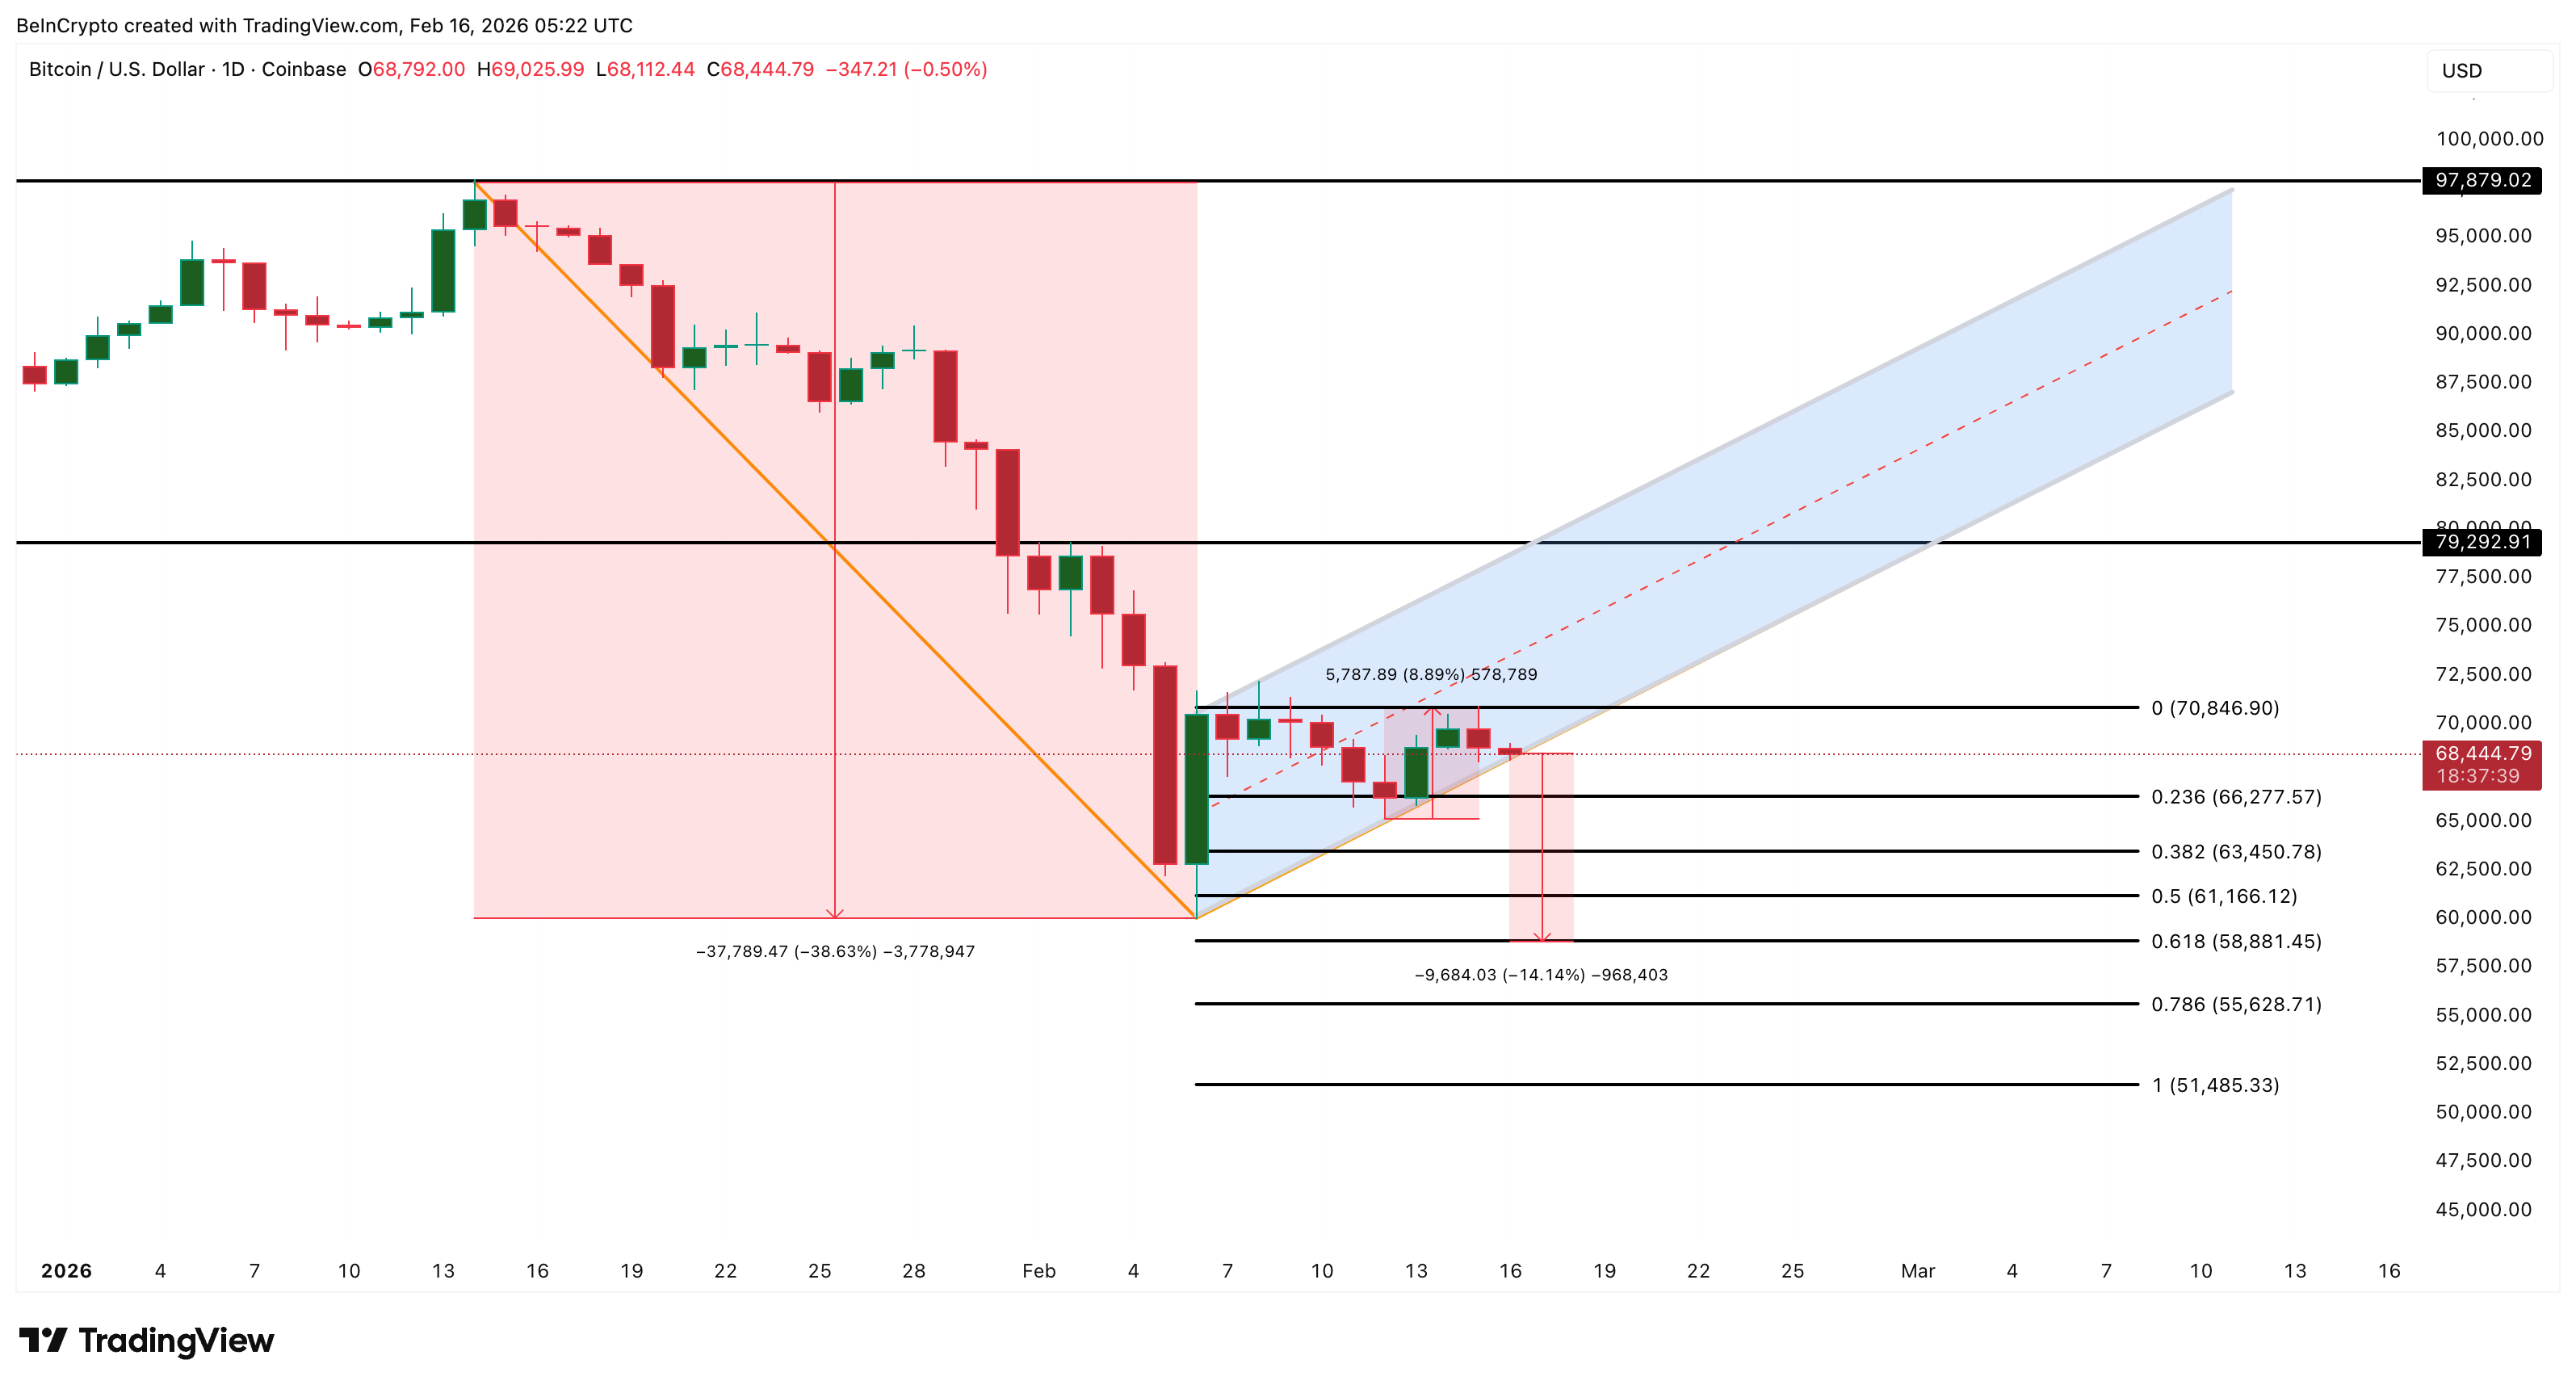
If selling pressure accelerates further, Bitcoin could fall toward the $55,620 zone, which aligns with the deeper projection of the bear flag structure. On the upside, Bitcoin must reclaim $70,840 to stabilize in the short term.
A stronger breakout above $79,290 would fully invalidate the bearish structure. That would signal that buyers have regained control. Until then, the risk remains tilted to the downside. The recent bounce improved sentiment briefly. But rising leverage, hidden bearish divergence, and a 90% surge in unrealized profits now show that the Bitcoin price recovery may have created the conditions for another drop.